EDA report: titanic3.csv
1. Overview
| Rows | Columns | Missing cells | Duplicate rows | Memory |
|---|---|---|---|---|
| 1,309 | 14 | 21.04% | 0 | 0.22 MB |
Column kinds: 6 numeric, 6 categorical, 1 boolean, 1 id
2. Things to look at next
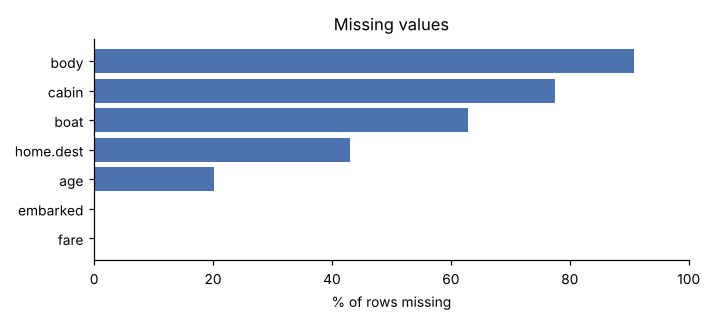
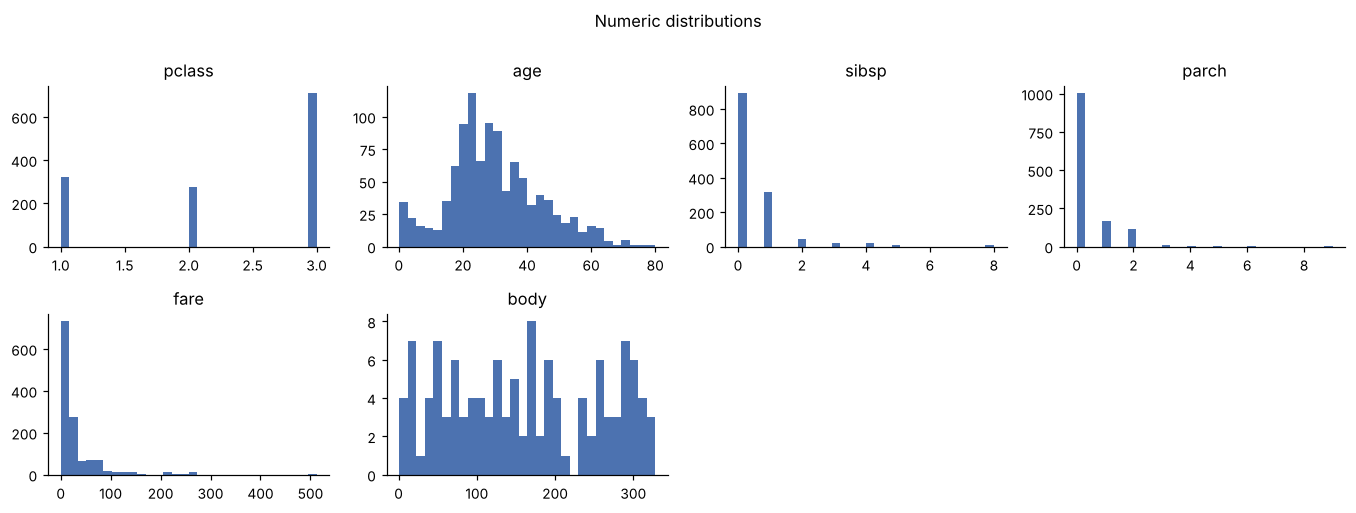
namelooks like an ID (unique per row): do not use it as a feature.sibspis very skewed (skew 3.8): consider a log transform or a robust model.parchis very skewed (skew 3.7): consider a log transform or a robust model.tickethas 929 categories: one-hot encoding will create many columns; group rare values or use target encoding inside cross-validation.fareis very skewed (skew 4.4): consider a log transform or a robust model.farehas 171 values outside 1.5 x IQR: check whether they are errors or real.cabinis 77% missing. Ask why it is missing: if it is only filled in for some outcomes it can leak the target (run leakage-check).cabinhas 186 categories: one-hot encoding will create many columns; group rare values or use target encoding inside cross-validation.boatis 63% missing. Ask why it is missing: if it is only filled in for some outcomes it can leak the target (run leakage-check).bodyis 91% missing. Ask why it is missing: if it is only filled in for some outcomes it can leak the target (run leakage-check).home.destis 43% missing. Ask why it is missing: if it is only filled in for some outcomes it can leak the target (run leakage-check).home.desthas 369 categories: one-hot encoding will create many columns; group rare values or use target encoding inside cross-validation.
3. Columns
| Column | Kind | Type | Missing | Unique |
|---|---|---|---|---|
pclass |
numeric | int64 | 0.0% | 3 |
survived |
boolean | int64 | 0.0% | 2 |
name |
id | str | 0.0% | 1,307 |
sex |
categorical | str | 0.0% | 2 |
age |
numeric | float64 | 20.09% | 98 |
sibsp |
numeric | int64 | 0.0% | 7 |
parch |
numeric | int64 | 0.0% | 8 |
ticket |
categorical | str | 0.0% | 929 |
fare |
numeric | float64 | 0.08% | 281 |
cabin |
categorical | str | 77.46% | 186 |
embarked |
categorical | str | 0.15% | 3 |
boat |
categorical | str | 62.87% | 27 |
body |
numeric | float64 | 90.76% | 121 |
home.dest |
categorical | str | 43.09% | 369 |
4. Missing values
5. Numeric columns
| Column | Mean | Std | Min | Median | Max | Skew | Outliers (1.5 IQR) |
|---|---|---|---|---|---|---|---|
pclass |
2.295 | 0.838 | 1 | 3 | 3 | -0.60 | 0 |
age |
29.881 | 14.413 | 0.167 | 28 | 80 | 0.41 | 9 |
sibsp |
0.499 | 1.042 | 0 | 0 | 8 | 3.84 | 57 |
parch |
0.385 | 0.866 | 0 | 0 | 9 | 3.67 | 0 |
fare |
33.295 | 51.759 | 0 | 14.454 | 512.329 | 4.37 | 171 |
body |
160.81 | 97.697 | 1 | 155 | 328 | 0.09 | 0 |
6. Categorical columns
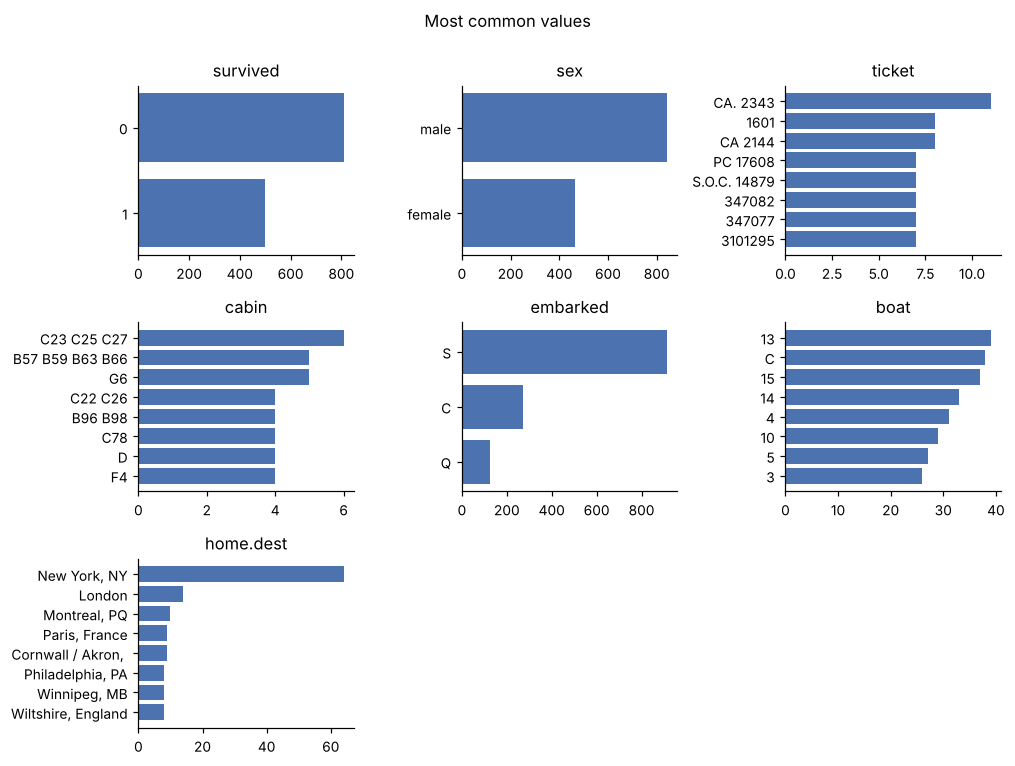
| Column | Categories | Most common |
|---|---|---|
survived |
2 | 0 (61.8%), 1 (38.2%) |
sex |
2 | male (64.4%), female (35.6%) |
ticket |
929 | CA. 2343 (0.84%), 1601 (0.61%), CA 2144 (0.61%) |
cabin |
186 | C23 C25 C27 (0.46%), B57 B59 B63 B66 (0.38%), G6 (0.38%) |
embarked |
3 | S (69.82%), C (20.63%), Q (9.4%) |
boat |
27 | 13 (2.98%), C (2.9%), 15 (2.83%) |
home.dest |
369 | New York, NY (4.89%), London (1.07%), Montreal, PQ (0.76%) |
7. Correlations
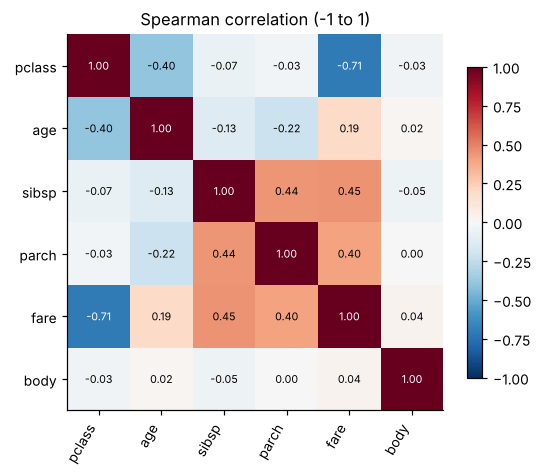
Spearman correlation: +1 = always rise together, -1 = one rises when the other falls, 0 = no monotonic link.
| Column A | Column B | Spearman |
|---|---|---|
pclass |
fare |
-0.709 |
sibsp |
fare |
0.446 |
sibsp |
parch |
0.438 |
parch |
fare |
0.4 |
pclass |
age |
-0.396 |
age |
parch |
-0.216 |
age |
fare |
0.193 |
age |
sibsp |
-0.13 |
pclass |
sibsp |
-0.067 |
sibsp |
body |
-0.051 |
8. Target: survived (classification)
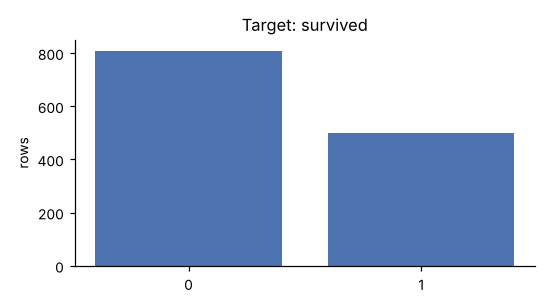
Class shares: 0 61.8%, 1 38.2%
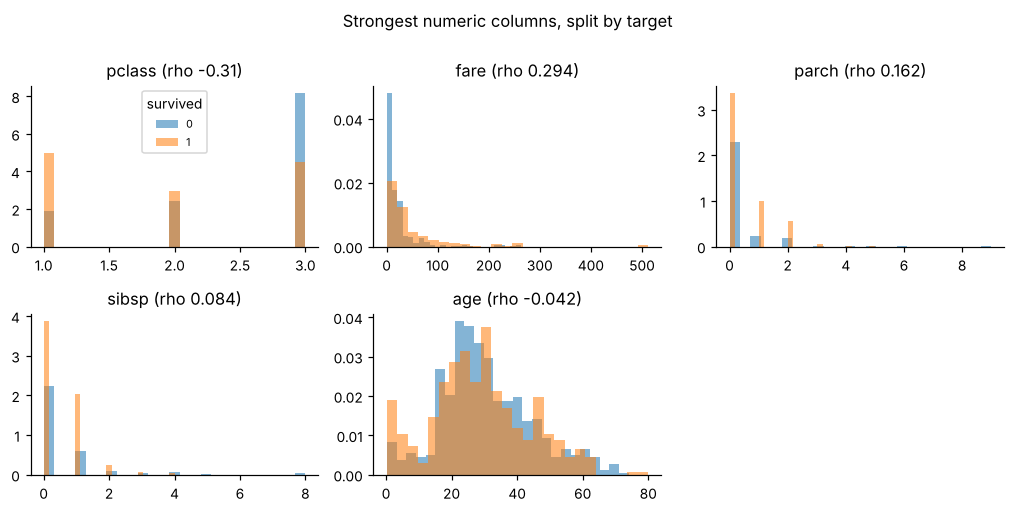
Columns most related to the target (Spearman for numbers, eta² for categories: share of the target's variation explained by the groups). Related is not the same as causal.
| Column | Measure | Value |
|---|---|---|
pclass |
spearman | -0.31 |
fare |
spearman | 0.294 |
sex |
eta2 | 0.28 |
boat |
eta2 | 0.176 |
parch |
spearman | 0.162 |
sibsp |
spearman | 0.084 |
age |
spearman | -0.042 |
embarked |
eta2 | 0.034 |